Angels Bullpen Effectiveness (2025) by Caleb Newton
Purpose: Help a motivated baseball fan or student research the Los Angeles Angels’ bullpen and draw insights from public data and articles.
Data sub-genre focus: Sports Analytics → Team Relief Pitching (usage/roles, HR/9, ERA vs. xFIP, late-inning leverage).
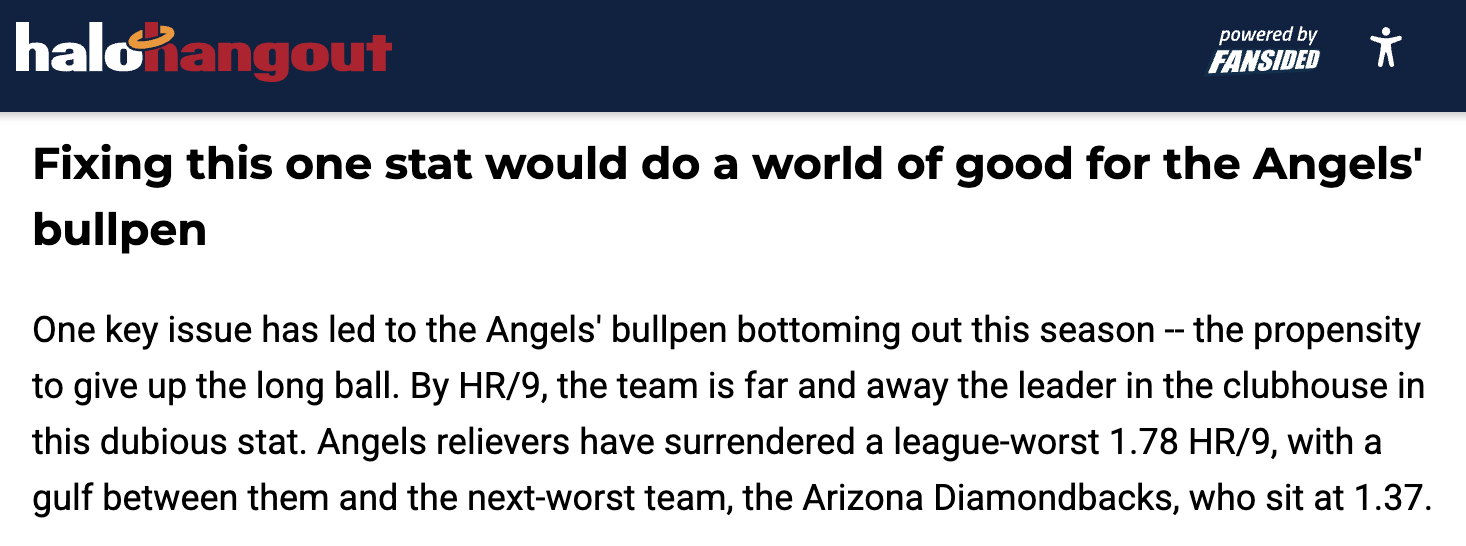
Step 1 — Frame the problem. Articles point to home runs (HR/9) driving bullpen struggles and show a gap between ERA and xFIP that highlights it.
Start with HR/9 and recent workload.”
While single-game blowups get attention, the bigger pattern often appears over weeks: late-inning mistakes after consecutive-day usage, or tough platoon pockets faced by the wrong arm.
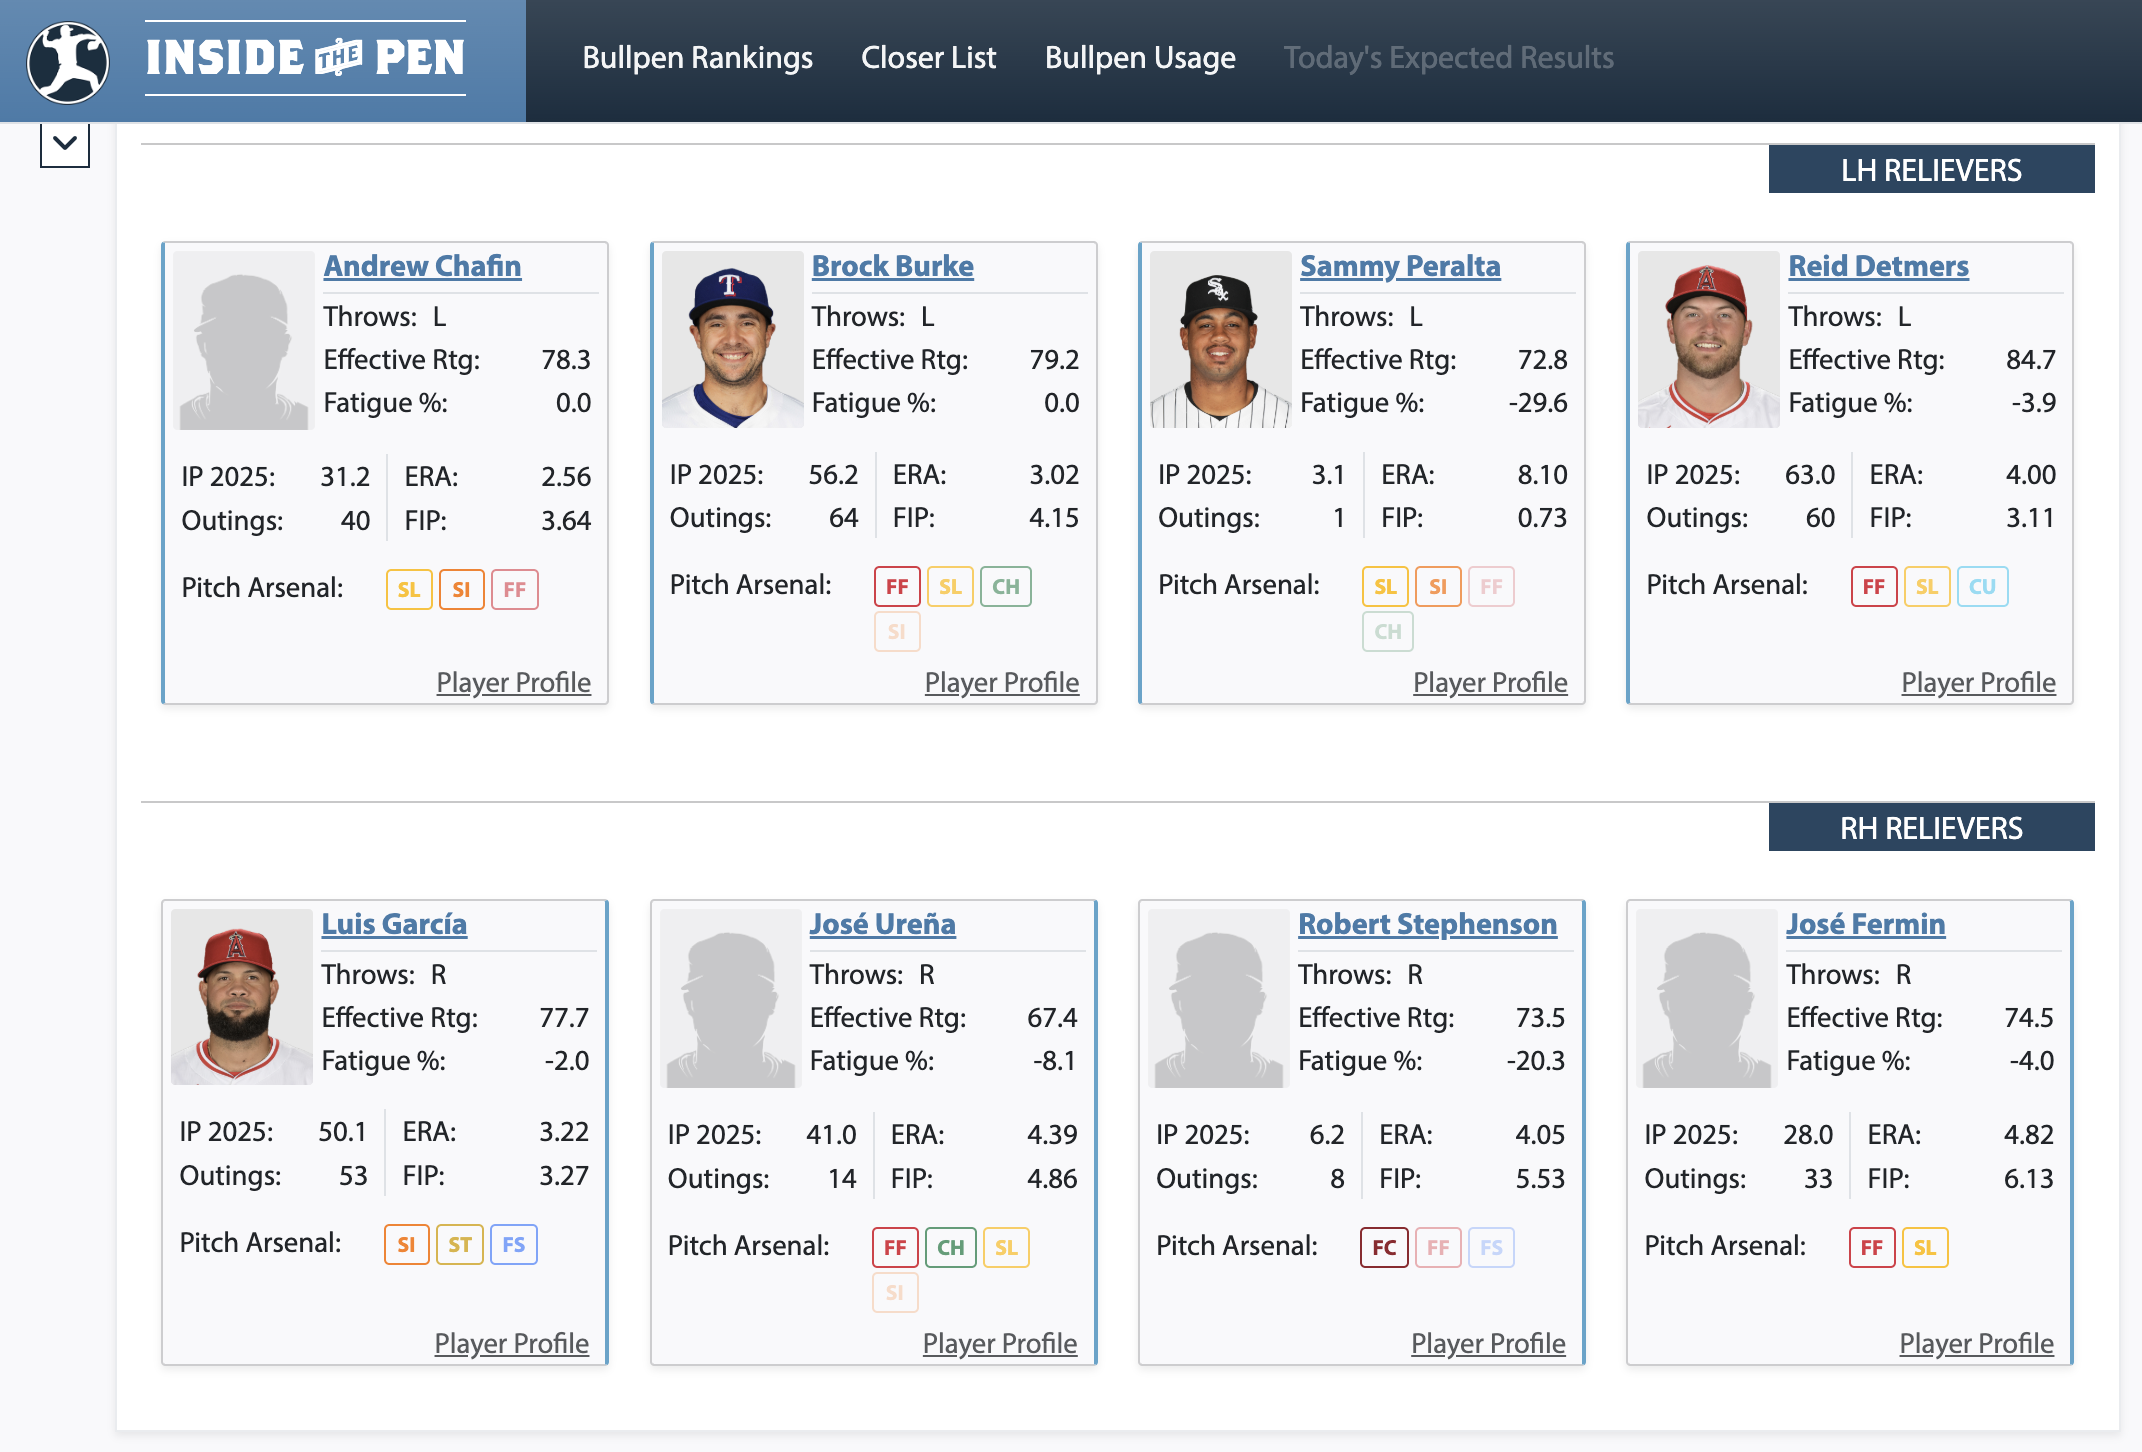
Step 2 — Add usage & roles. A bullpen tracker shows who is closing, who sets up, and how often each reliever has pitched lately. Readers can scan the roles and match those to loss-leverage innings.
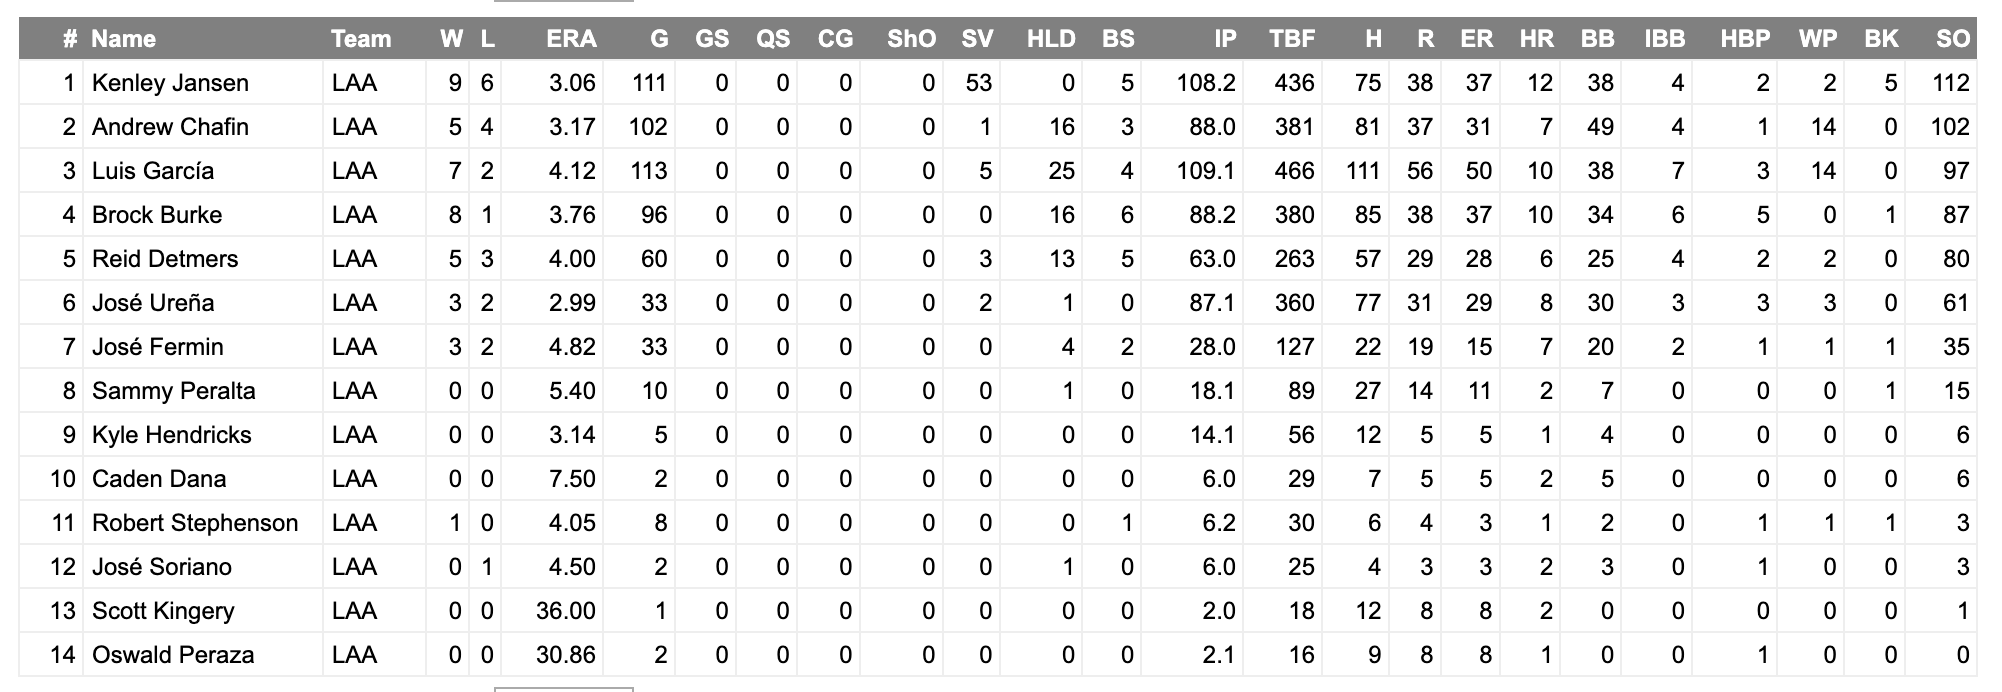
Step 3 — Show league context. Put the Angels among MLB peers using a reliever leaderboard. Include ERA, FIP, HR/9, K/9, and BB/9. A clear table screenshot lets a reader see whether the club is bottom-tier because of strike throwing or HR contact.
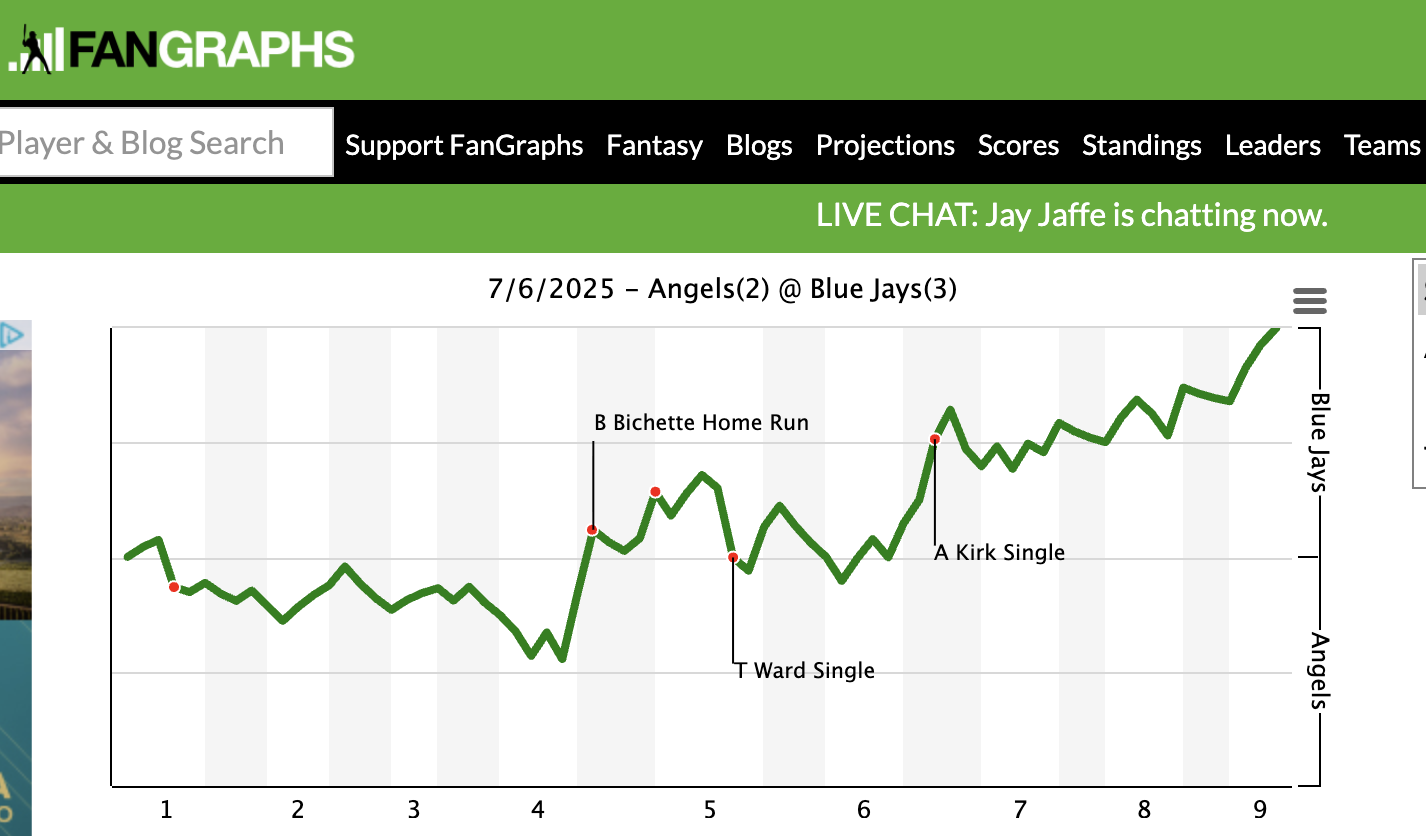
Step 4 — Use a game example. A Win Probability (WP) graph shows the inning where control flipped. Pair this with usage notes: was the high-leverage arm on a back-to-back? Was a platoon mismatch exposed?
Takeaway: Combining HR/9 framing with usage patterns, league context, and a single-game visualization helps a reader propose fixes.
Web Resources
Halo Hangout — analysis article that frames the HR/9 problem.
https://halohangout.com/…
InsideThePen — bullpen usage tracking (roles, recent workload, fatigue ideas).
https://insidethepen.com/team/LAA-bullpen.html
FanGraphs — reliever leaderboards and Win Probability graphs.
https://www.fangraphs.com/teams/angels
Screenshot filenames: haloHR.png itpUsage.png fgLeaders.png fgWP.png